Data through 2026-06-10 | Co-written by the Fable 5 model and Yikun Ding
“Scaling has hit a wall.”
“The AI bubble is about to pop.”
“AGI is 18 months away.”
The AI discourse of 2026 might be the most polarized in tech history. On one side: a curve showing model capability doubling every ~4 months. On the other: 81% of executives saying AI has produced no meaningful profit impact.
So what is actually going on?
We pulled every hard number we could find for 2023–2026: a capability index stitched from 39 benchmarks, METR’s task-length horizon, the price of fixed-capability inference, adoption rates counted three different ways, 8 randomized controlled trials, hyperscaler capex (capital expenditure — mostly chips and data centers), frontier-lab revenue — 43 public sources, 6 charts.
The headlines first:
- The model layer didn’t slow down — it hit the gas in early 2024. Three independent sources point to the same breakpoint: capability growth ×1.85, task-length doubling time down from ~8 months to ~114 days, fixed-capability price declines up from 50× to 200× per year.
- “The application layer is slow” is an illusion. Only the profit evidence is slow. Usage and revenue are exponential: Claude Code hit an $8B run-rate in 12 months; token volume grew 330× in 25 months. Yet 81% of enterprises still report no meaningful profit impact.
- The money gap is still 9× — but its nature has changed: the denominator (revenue) grew 5–7× in 18 months.
- The real picture isn’t “fast models, slow apps.” It’s a phase difference between three curves: capability is an exponential, adoption is the early leg of an S-curve, and profit is the bottom of a J-curve.
Let’s take it layer by layer.
01 | The Yardsticks Are Wearing Out: Release-to-Saturation in 11 Months
To judge AI’s speed, the first instinct is to look at benchmark scores.
But after 2023, benchmark charts got harder and harder to draw — not because models stopped climbing, but because the yardsticks keep breaking.
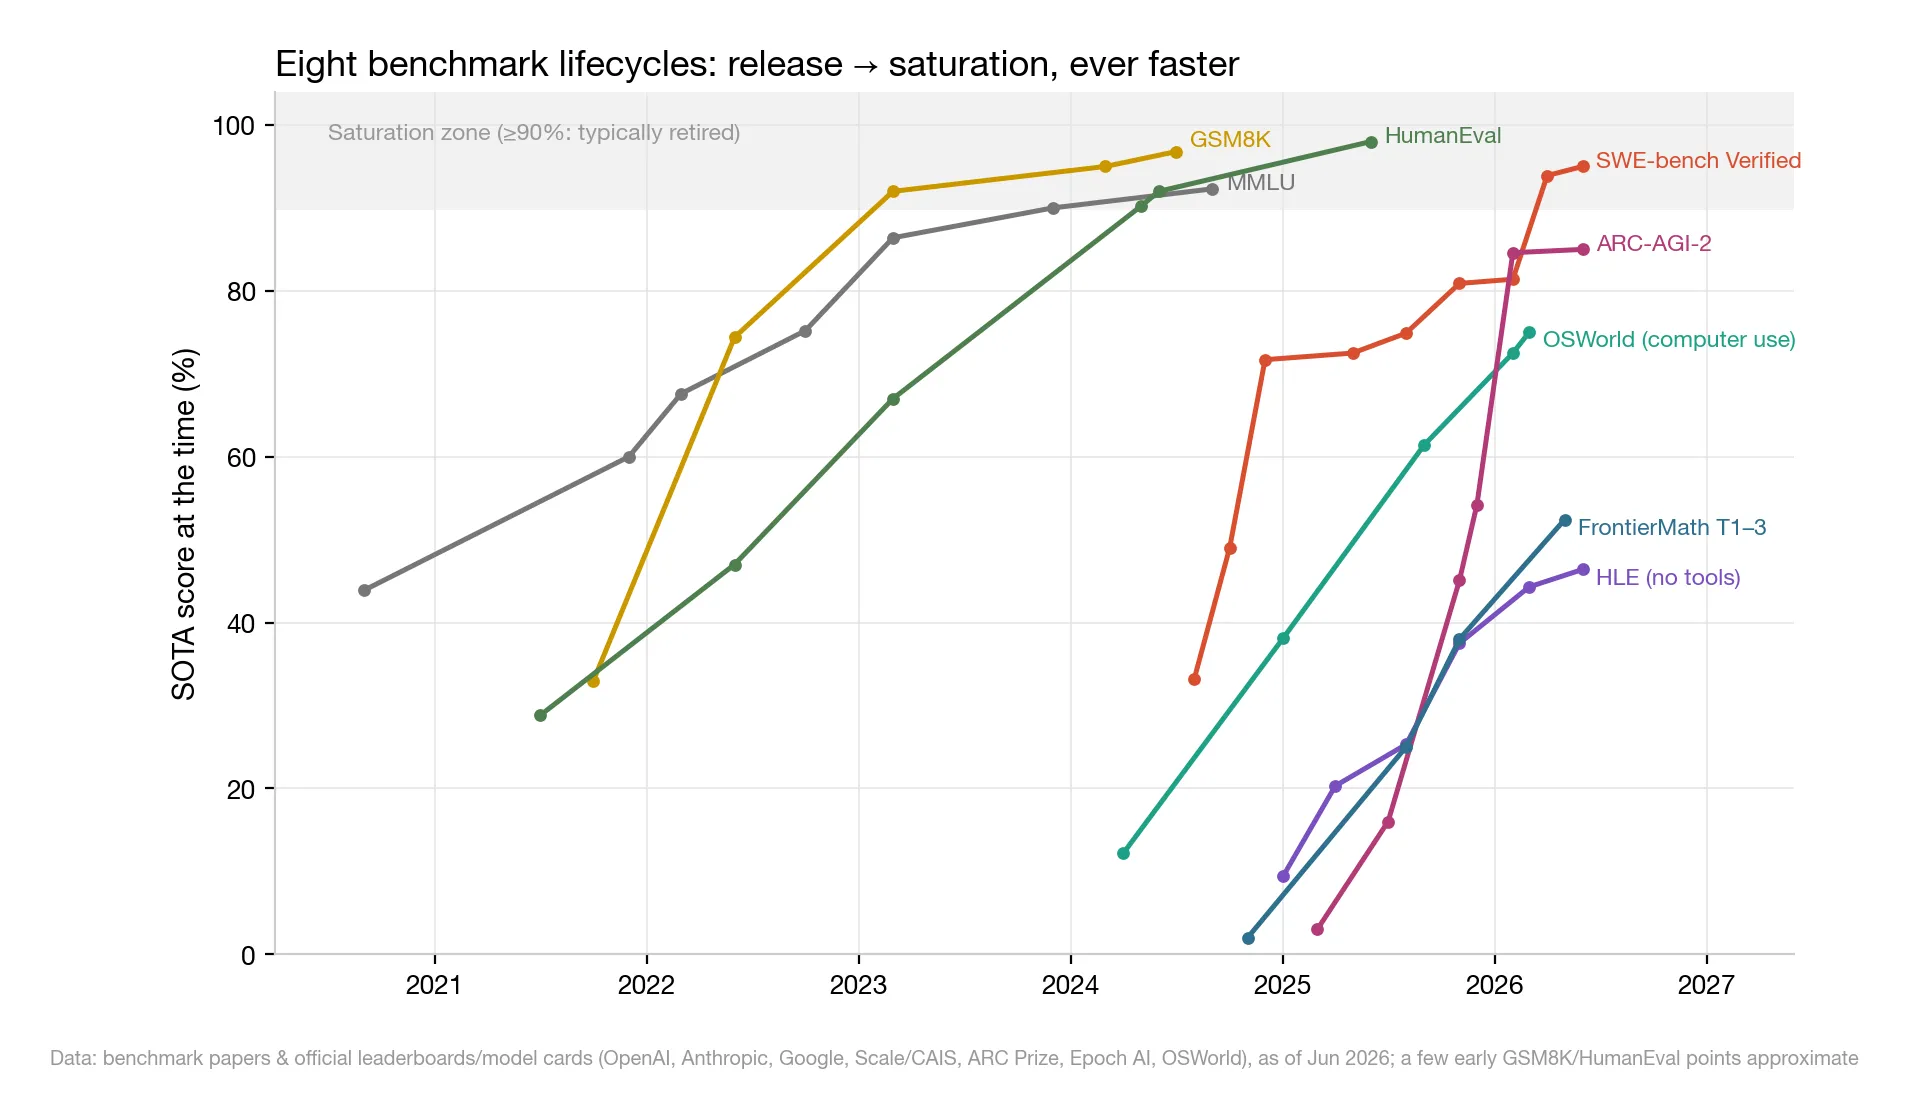
△ Figure 1: Lifecycles of eight representative benchmarks; the gray band marks ≥90% saturation. Scores aren’t comparable across benchmarks — what matters is each one’s release-to-saturation shape
Put the major benchmarks since 2020 on one chart and the pattern is unmistakable:
- MMLU (2020): GPT-3 started at 43.9%; pushing past 90% took ~39 months;
- GSM8K (2021): driven to 95% in 29 months, then retired over contamination — the problems had leaked into training data, like students memorizing the answer key;
- SWE-bench Verified (Aug 2024): started at 33.2%; 15 months to cross 80% (Claude Opus 4.5), 93.9% at 20 months, ~95% for the latest generation;
- ARC-AGI-2 (Mar 2025): billed as “designed to stump LLMs,” every reasoning system scored ≤3% at launch. Eleven months later: 84.6% (Gemini 3 Deep Think).
Release-to-saturation went from 3 years, to 15 months, to 11 months.
Only two yardsticks remain unbroken: HLE (Humanity’s Last Exam — the hardest questions experts across every discipline could come up with; best score 46.4%) and FrontierMath (research-grade problems written by professional mathematicians; 52.4% on tiers 1–3). And the latter was just audited by Epoch — roughly 1 in 3 problems turned out to be flawed.
Humans are now writing exams slower than AI can pass them.
One more thing about agents: OSWorld (a benchmark where models operate a real computer) went from 12.2% to 75% in 23 months — past the human baseline of 72.4%. Agents aren’t lagging chat capability; they’re riding the same curve, started two years later.
02 | Stitch 39 Benchmarks Into One Ruler: the Breakpoint Is April 8, 2024
Individual benchmarks saturate, leak into training data, get retired. What then?
The academic fix: use a statistical model to align dozens of benchmarks onto a single scale — think of converting SAT, ACT, and A-level scores onto one standardized axis. Epoch AI’s Capabilities Index (ECI) stitches together 149 models across 39 benchmarks this way.
Connect the best model at each point in time into a frontier line, fit a straight line to each half, and ask where the slope changed. You get this:
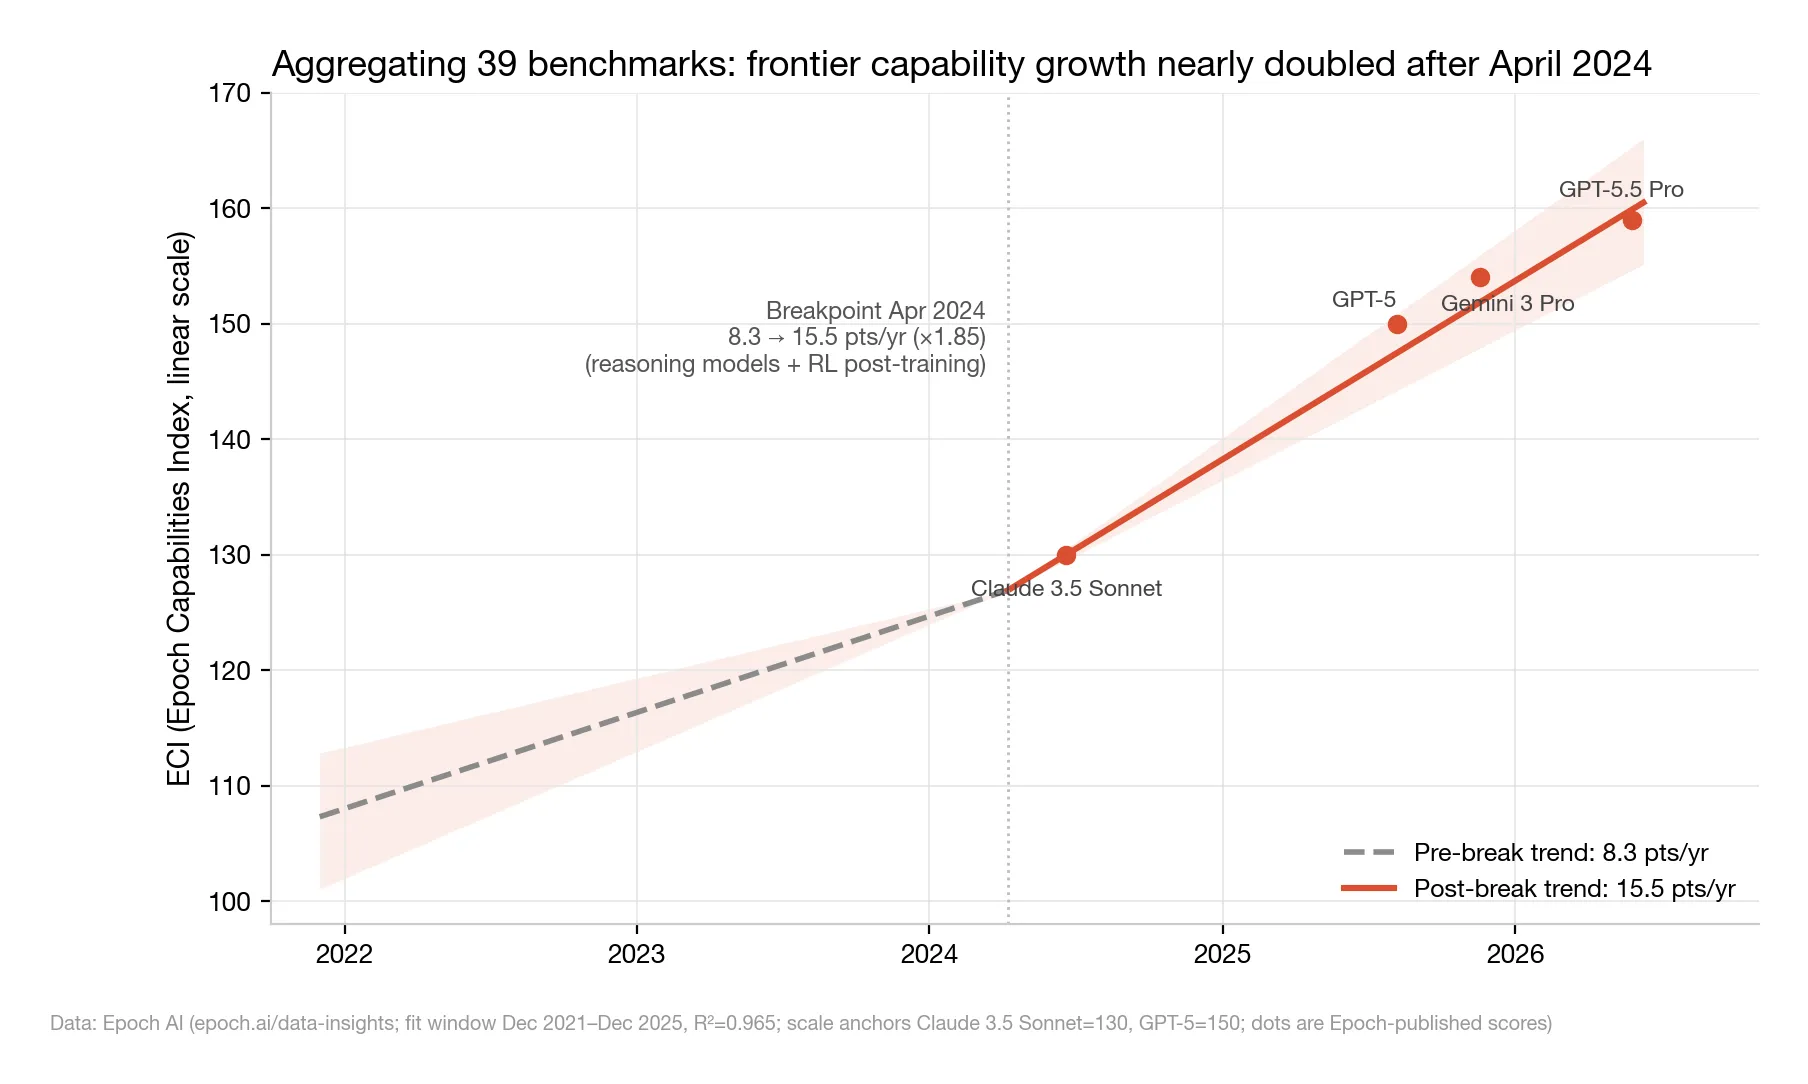
△ Figure 2: Epoch Capabilities Index (ECI) frontier trend; the dashed line extrapolates the pre-breakpoint slope
Breakpoint: April 8, 2024. The slope jumps from 8.3 to 15.5 points/year — ×1.85 (R²=0.965; a perfect fit would be 1.0, so the line hugs the data almost exactly).
What happened around that date? The industry’s pivot to large-scale reinforcement-learning post-training — five months later, o1 introduced “think-then-answer” reasoning models to the world.
And the post-breakpoint trendline still holds today: GPT-5 at 150, Gemini 3 Pro at 154, GPT-5.5 Pro at 159 — all sitting right on the 15.5-points/year extrapolation.
No sign of a slowdown.
03 | A Ruler That Can’t Saturate: From 3 Seconds to 17 Hours
Benchmark scores have a ceiling. Time doesn’t.
METR (a Berkeley-based nonprofit evaluation lab) measures a “time horizon” with a clever unit: how long would a human expert need for the tasks a model can complete at a 50% success rate?
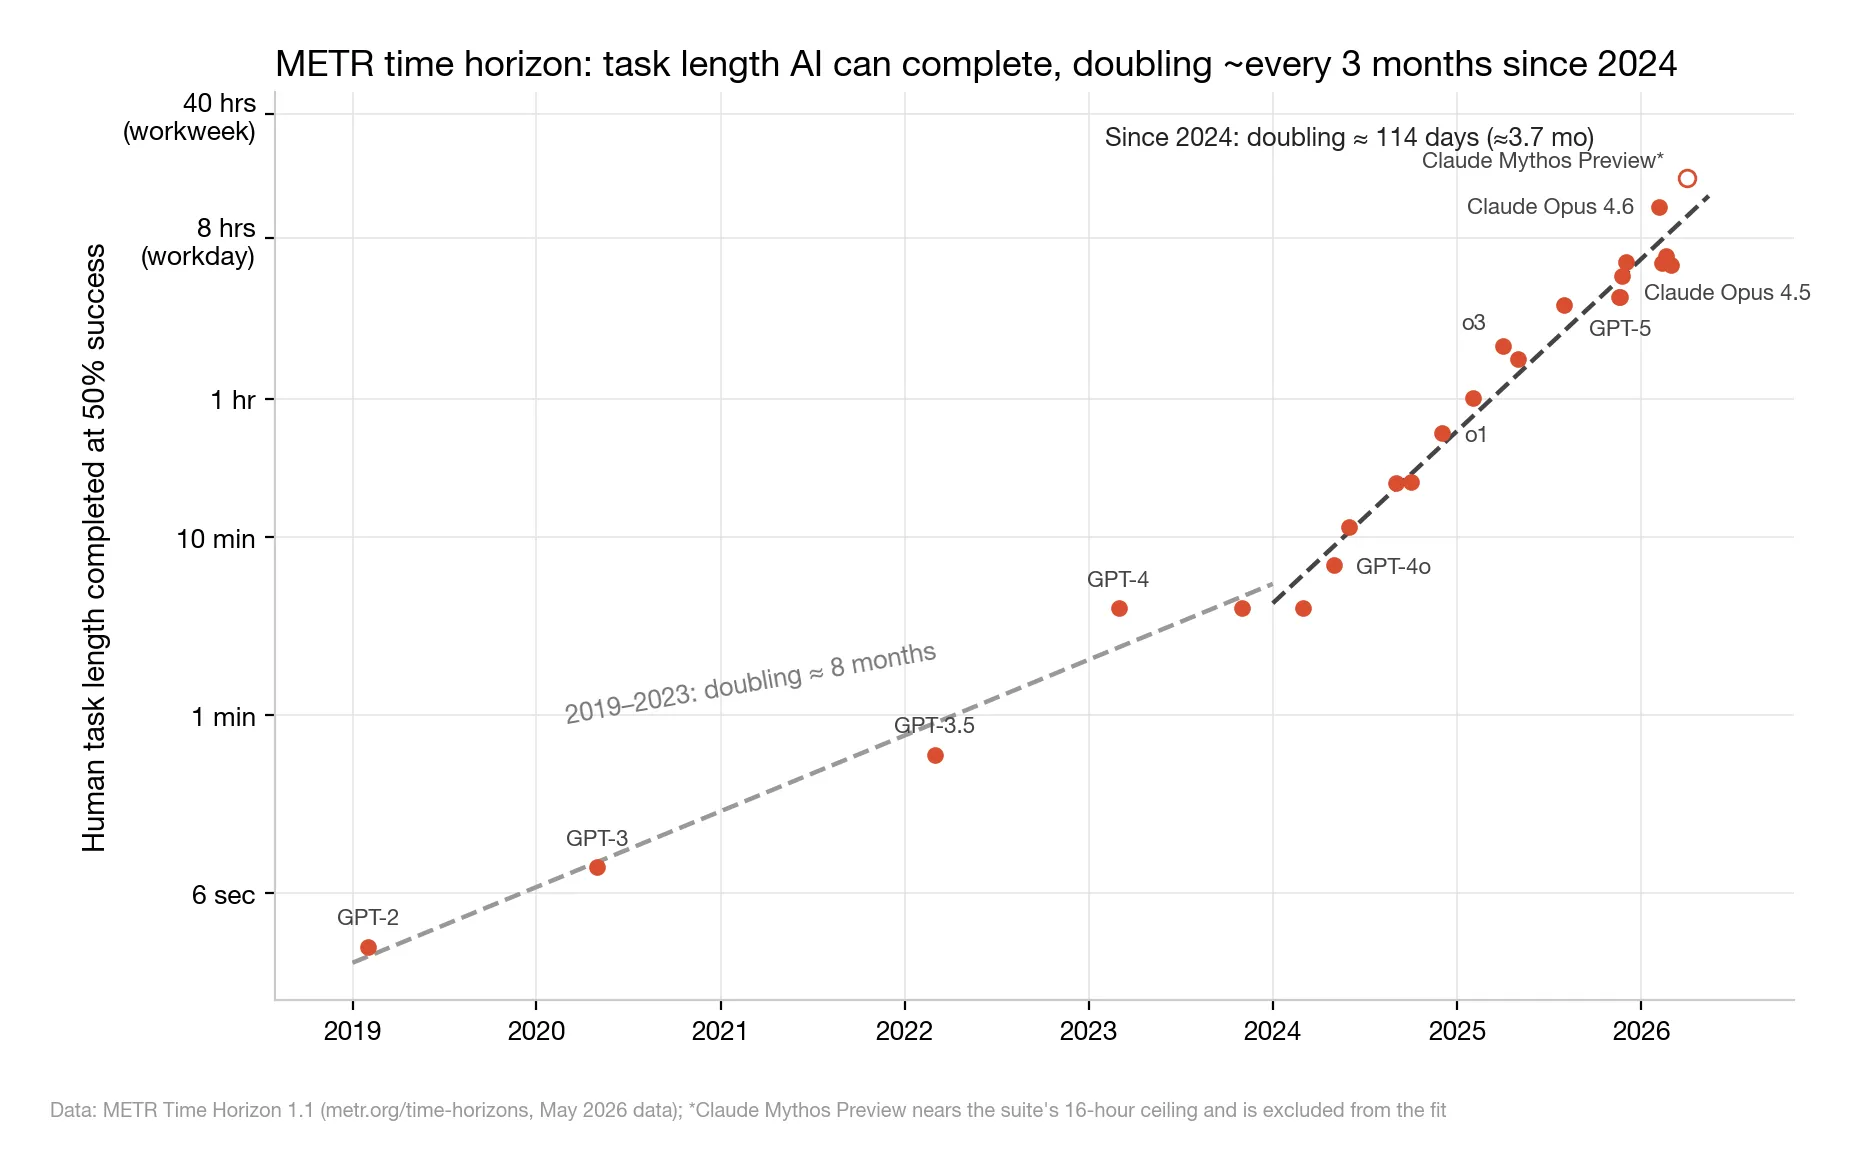
△ Figure 3: METR 50% time horizon (log scale). The latest point hits the task suite’s 16-hour ceiling and is excluded from the fit
The line spans five orders of magnitude:
- 2019, GPT-2: about 3 seconds;
- April 2026, Claude Mythos Preview: about 17 hours.
Doubling time: ~8 months from 2019–2023; ~114 days since 2024 (our refit of their public data; METR’s official TH1.1 figure is 89 days). By early 2026, Claude Opus 4.6’s horizon sits around 12 hours — a full working day.
Interactive agent benchmarks trace the same shape: on τ²-bench (an agent benchmark built around multi-turn customer-service chats — looking up orders, changing flights), GPT-4o scored under 50% in 2024; GPT-5.2 is at 98.7%.
One caveat to remember: 50% success is a lenient bar. At 80% success, the horizon shrinks by roughly an order of magnitude. That’s the mathematical root of “superhuman on benchmarks, intern-grade in workflows” — we’ll come back to it in section 07.
04 | Intelligence Is Deflating. Flagships Are Getting More Expensive.
Efficiency is the most underrated half of the model-layer story.
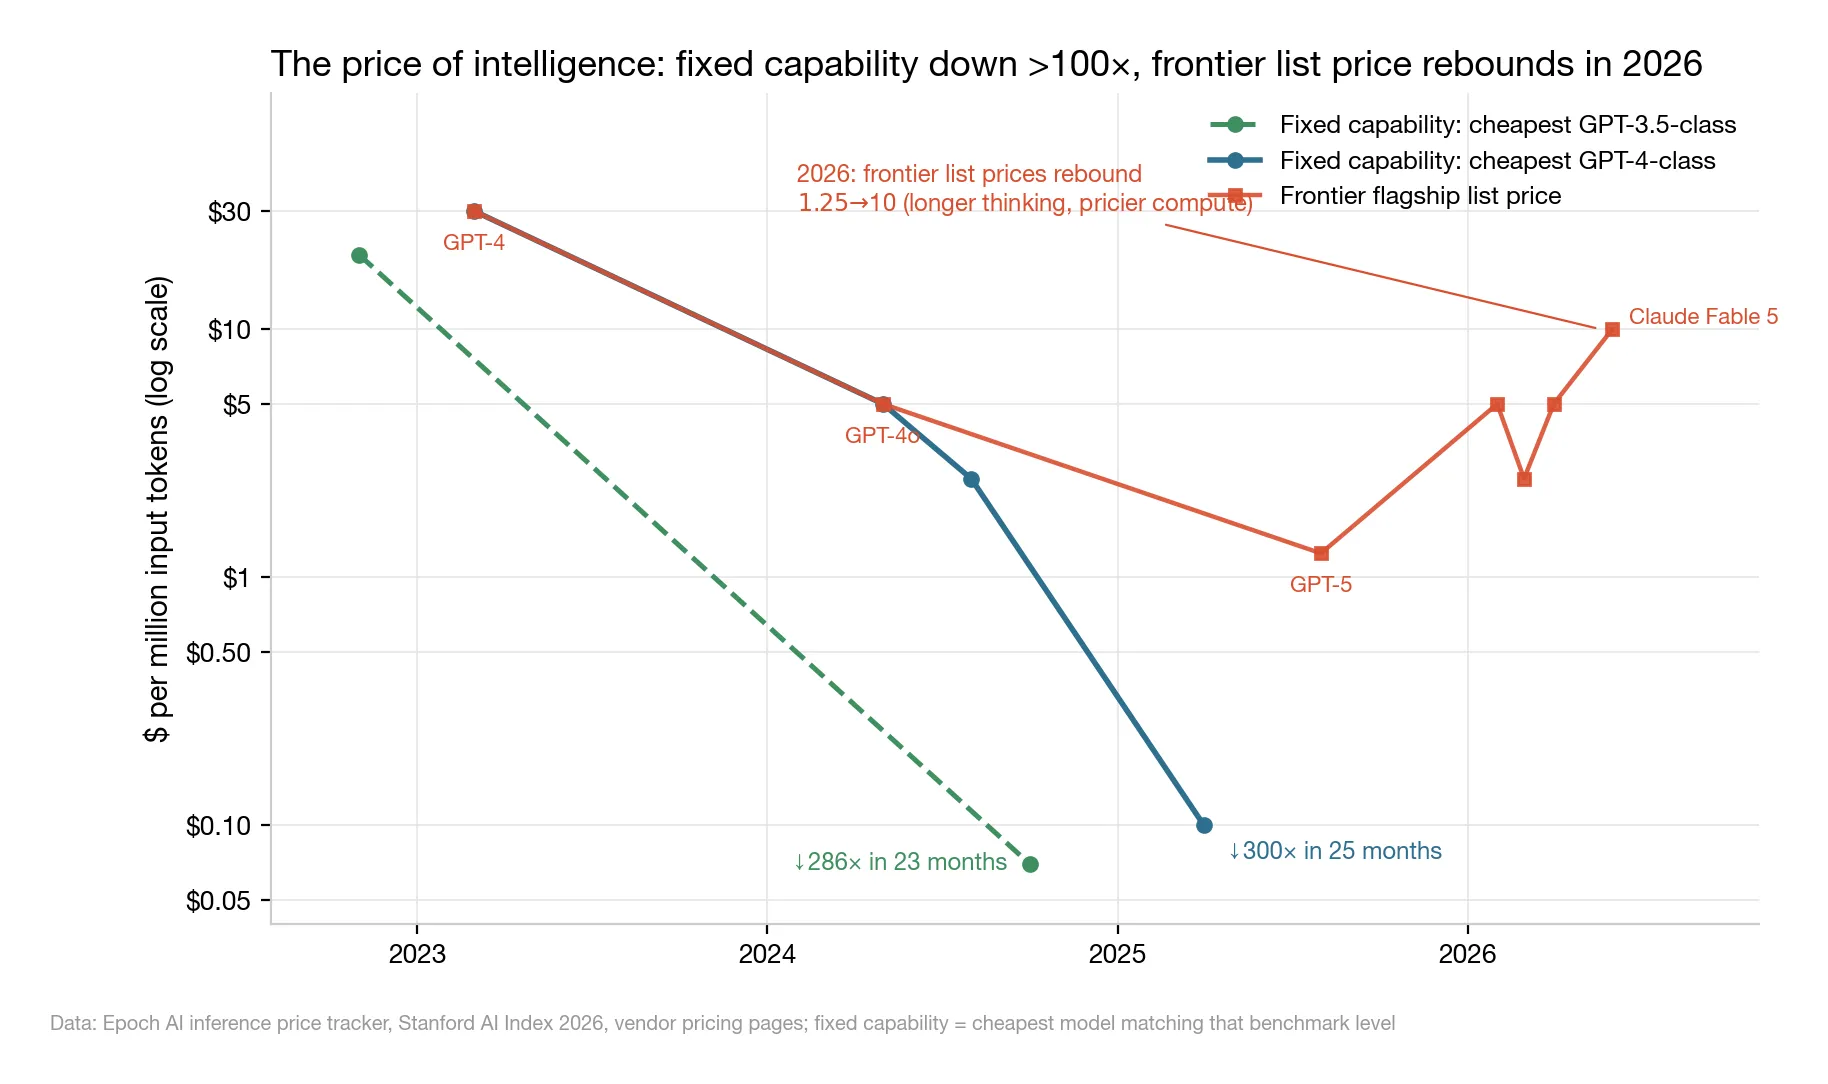
△ Figure 4: The two-track price of intelligence — fixed-capability prices collapsing, flagship list prices rebounding
Fixed-capability prices are collapsing:
- GPT-4-class: $30 → $0.10 per million tokens (the unit AI usage is billed in; a million tokens ≈ 750,000 English words) — down 300× in two years;
- GPT-3.5-class: $20 → $0.07, roughly 280×;
- Epoch’s estimate: the median annual price decline for fixed capability was ~50×; in post-2024 windows it rose to ~200× per year.
But the other track runs the opposite way: flagship list prices turned upward in 2026 — GPT-5 launched at $1.25, GPT-5.5 at $5, Claude Fable 5 at $10.
“Intelligence deflation” holds for fixed capability, not for frontier capability. Two-year-old intelligence sells at floor prices; this-minute-best intelligence is being repriced.
At this point the model layer has three independent chains of evidence: the ECI breakpoint at 2024-04, METR’s doubling time halving since 2024, and price-decline slopes quadrupling since 2024. “A second acceleration began in the first half of 2024” is the most robust conclusion in current AI data.
The supply side checks out too: frontier training compute grows ~5×/year, algorithmic efficiency ~3×/year — multiply them, and effective compute grows roughly 10× per year.
05 | The Application Layer: Usage Grows Exponentially, 1% Make Money
Models are this strong. Are companies making money?
This is the most tangled — and most informative — layer of the story.
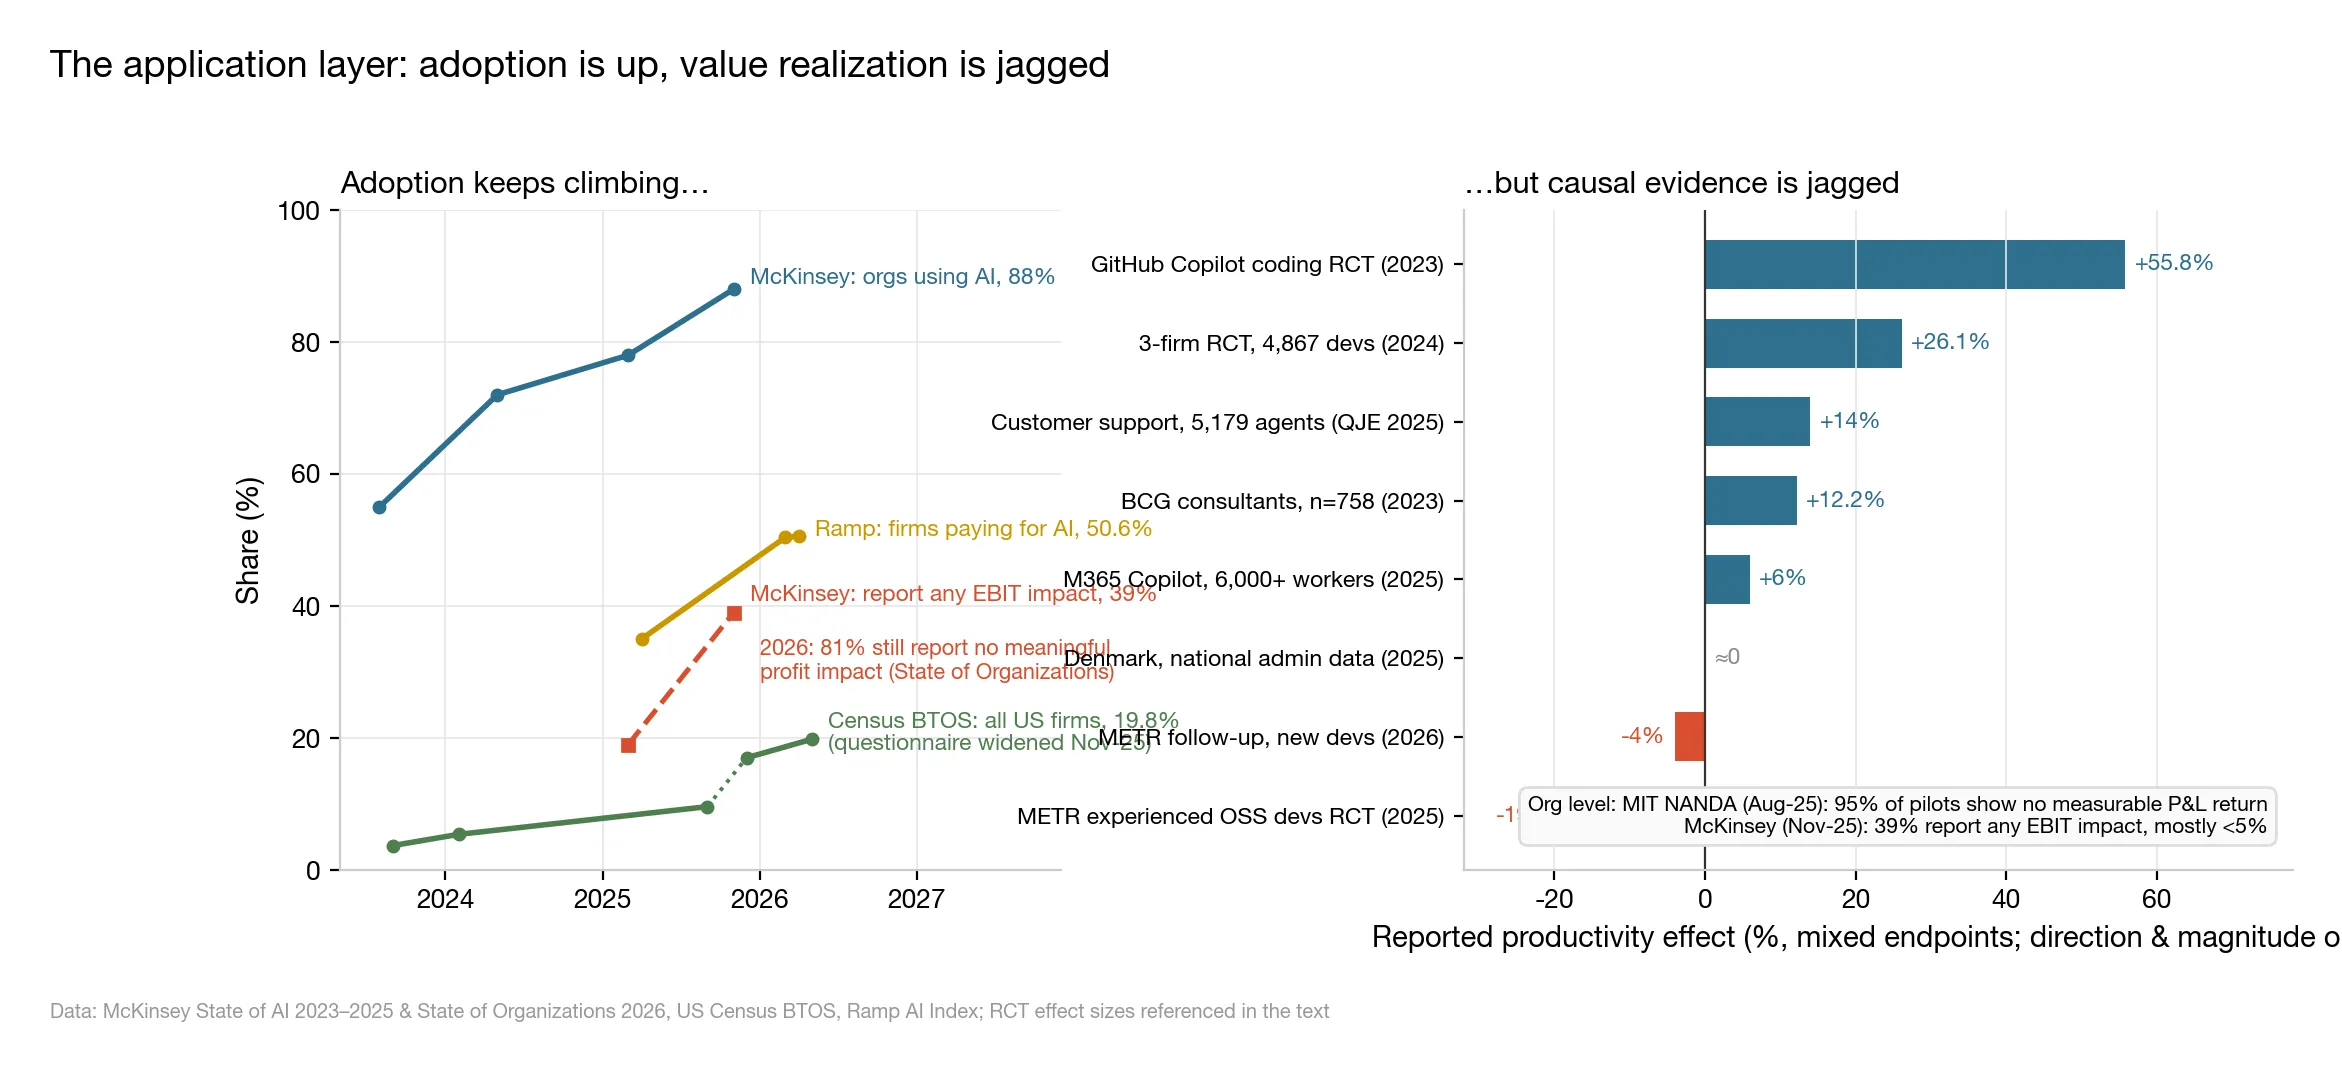
△ Figure 6: Left — adoption counted three different ways, plus profit impact; right — productivity effects measured by 8 causal studies, ranked largest to smallest
Question one: how many companies actually use AI?
There is no single answer — it depends on whom you ask and how you count:
- Ask big-company executives whether their organization uses AI, and McKinsey’s survey says 88% do;
- Skip the talk and follow the bills. Ramp manages corporate cards and expenses for tens of thousands of businesses, so it sees exactly who gets paid — by its count, 50.6% of US businesses pay real money for AI products, up from 35% a year ago;
- Count every US business, barbershops and auto shops included, and the Census Bureau’s official survey finds just 19.8%.
A 4× spread, and nobody is lying: big firms move first, saying you use AI is easier than paying for it, and most small shops haven’t started. What matters is the direction — all three lines point up.
Question two: are the people using AI actually getting work done faster?
Note that using is not the same as benefiting. Answering this takes an experiment. The gold standard is the randomized controlled trial (RCT) — the same method used to test new drugs: randomly split people into two groups, give one AI and not the other, have them do the same work, and run the stopwatch. The speed gap between the groups is AI’s true contribution.
The right panel of Figure 6 ranks the 8 most serious studies, largest to smallest. They span the whole spectrum — from 56% faster to 19% slower:
- +55.8%: two groups of developers built the same small program; the GitHub Copilot group finished more than half again faster. Standardized task, clear goal — AI’s home turf;
- +26%: nearly 5,000 developers at Microsoft, Accenture, and a Fortune 100 firm, measured over months of everyday work; the AI group completed about 26% more tasks;
- +14%: 5,179 customer-support agents with an AI assistant resolved 14% more issues per hour. Novices improved most, veterans barely moved (published in the QJE, a top economics journal);
- +12.2%: BCG (Boston Consulting Group) consultants ran analysis tasks 12.2% faster. But the researchers also planted tasks that look AI-solvable and aren’t — and on those, consultants using AI got more answers wrong;
- Zero: the studies above ran for weeks or months; Danish economists instead opened two years of national ledgers — official wage and hours records for 25,000 workers. Verdict: two years into chatbot adoption, no statistically visible change in earnings or hours;
- −19%: the only negative number of the eight.
That last number deserves its own section.
METR (the same evaluation lab that measures the time horizon in section 03) recruited 16 veteran open-source developers to do 246 real tasks in codebases they had maintained for years, with each task randomly labeled “AI allowed” or “AI forbidden.”
Result: tasks with AI allowed took 19% longer. Where did the time go? Writing prompts, waiting for generations, reviewing AI code, fixing AI mistakes — in a codebase you know blindfolded, AI behaves like an intern who needs constant hand-holding.
The crueler part is perception: asked to estimate afterward, the developers believed AI had made them 20% faster. Stopwatch and gut feeling, 39 percentage points apart. The 2026 follow-up experiment still hasn’t flipped positive.
At the organizational level, colder still:
- MIT NANDA: 95% of enterprise genAI pilots show no measurable return on the income statement (methodology contested; the magnitude is widely cited);
- McKinsey: only 39% of organizations report any AI impact on EBIT — earnings before interest and taxes; crudely, “is the core business actually making more money?” Meaning 61% can’t claim even a sliver of impact;
- An early-2026 survey of thousands of executives: 81% report no meaningful profit impact; just 1% rate their rollout “mature.”
At this point you might conclude: told you, the application layer is failing.
Not so fast. The same period produced another set of hard numbers with a completely different shape:
- Claude Code: $8B in annualized revenue within 12 months of launch (annualized = latest month’s revenue ×12; same convention below);
- Cursor: $2B in three years; Devin: 13× in one year, to $492M;
- ChatGPT: 900M weekly users, 50M paid subscriptions;
- Google’s all-products token volume: 9.7 trillion/month → 3.2 quadrillion/month — 330× in 25 months;
- Anthropic Economic Index: 77% of enterprise API traffic is now “full automation” — the model completes the entire task on its own, rather than ping-ponging with a human.
Usage is exponential. Payment is exponential. Only the profit evidence is flat.
What’s slow isn’t the application layer — it’s organizational change and accounting recognition. Stanford’s AI Index estimates that US users pocket ~$172B/year in consumer surplus — the gap between what people would be willing to pay and what they actually pay — more than the entire industry’s revenue. Enormous value is being created; it just lands outside GDP and the income statement.
06 | The Money: a 9× Gap, and Two Opposite Signals in the Same Month
Capital’s verdict is blunt: all in.
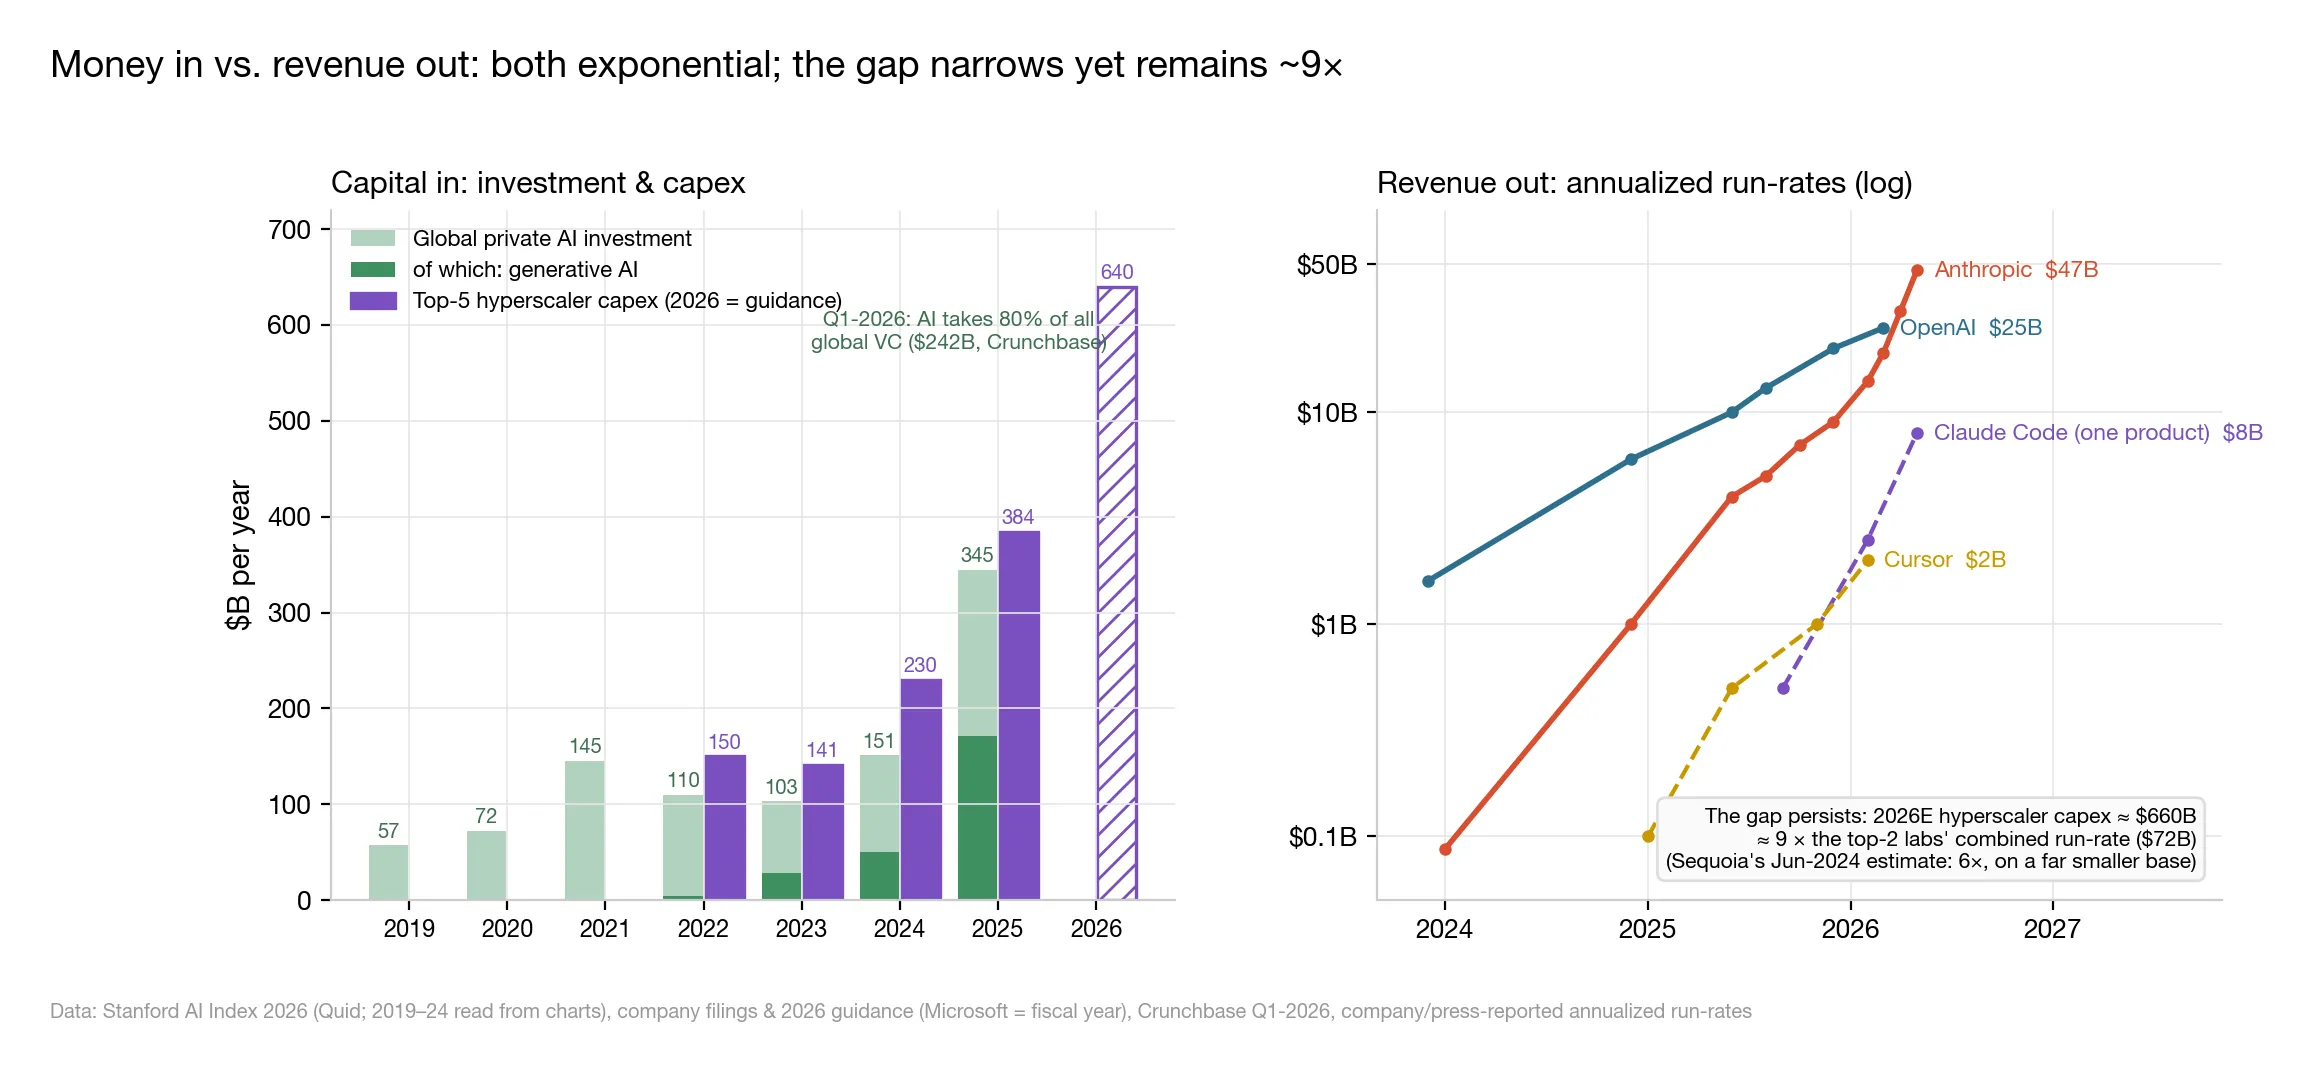
△ Figure 5: Left — investment and capex (bars); right — annualized revenue run-rates (log scale), with the 9× gap noted at lower right
- Global private AI investment in 2025: $344.7B (+127%), of which genAI took $170.9B;
- Q1 2026: AI captured 80% of all global VC ($242B);
- Hyperscaler capex: $141B (2023) → $384B (2025) → $610–690B guided for 2026.
Revenue is chasing exponentially: OpenAI above $25B annualized, Anthropic at $47B, enterprise genAI spend (Menlo’s measure) up from $2.3B to $37B in three years.
But divide 2026E capex (~$660B) by the combined revenue of the top two labs (~$72B) and you still get — 9×.
When Sequoia Capital posed its famous “$600B question” in June 2024 — where is AI going to find $600B a year in revenue to justify all those chips? — that multiple was 6. The ratio hasn’t improved. But the denominator (revenue) grew 5–7× in 18 months, which makes it a different kind of gap.
The strangest part: in May–June 2026, the same industry sent two opposite signals at once:
- Anthropic projected its first profitable quarter and confidentially filed an S-1 (the registration document for a US IPO);
- In the same window, OpenAI cut its $1.4T compute commitments to roughly $600B through 2030.
And Bain’s math hangs overhead: by 2030, supporting the compute buildout requires $2T/year in revenue — an $800B shortfall on current trajectories.
The money layer confirms neither “the bubble is popping” nor “demand is infinite.” It simply takes the scissors gap from section 05 and amplifies it with leverage.
07 | Nobody Is Lying. Four Things Are True at Once.
Capability compounding exponentially while profit lies flat — how can both hold?
Four mechanisms, each with data behind it, none contradicting the others:
1. The jagged frontier: AI’s skill map isn’t round — it’s jagged.
Human ability comes in connected blocks: anyone who can do calculus can do arithmetic. AI is not like that. It can crack an olympiad math problem, then miscount the letters in a word; it can write a sophisticated algorithm, then botch a trivial rename. Strengths and weaknesses interlock like the teeth of a saw.
That’s where the BCG reversal comes from: when a task landed on one of AI’s strong teeth, consultants were 12.2% faster; when it landed in a gap that merely looked like a strength, AI users got more answers wrong — and you can rarely tell which is which in advance.
Benchmarks measure the tallest teeth. A real workflow chains a dozen steps, and if one step falls into a gap, the whole chain breaks. Benchmark scores are set by AI’s strongest point; usability is set by its weakest.
2. The reliability discount: raise the passing bar, and the work AI can handle shrinks dramatically.
METR’s “12 hours” uses a 50% bar — succeed one attempt in two and it counts. Raise the bar to 80% (four in five), and the tasks AI can handle shrink from 12-hour jobs to 1–2-hour jobs. And before a company will let AI run inside a real production workflow with nobody watching, the bar usually sits closer to 99%.
Sounds fatal? Here’s the key fact: the discount is not growing over time. Eighteen months ago, the 80%-bar figure was a few minutes; now it’s 1–2 hours — climbing exactly as fast as the 50% line, just running behind it.
Two cars on the same highway at the same speed, one a few miles back. The trailing car isn’t parked. It just hasn’t reached your house yet.
3. Organizational absorption is historically the slowest link.
Electricity — an obvious bargain — still took factories ~30 years to turn into measured productivity gains. Swapping the steam engine for a motor wasn’t enough: the whole plant was built around one central drive shaft, and had to be torn down and rebuilt with a motor on every machine before electricity paid off. IT had its own version; economist Robert Solow quipped in 1987: “You can see the computer age everywhere but in the productivity statistics.”
Why does it always go this way? A company adopting new technology spends first — tools, training, process redesign, tuition paid in mistakes — so profit falls below the starting point for a few years, then climbs past it once the rebuild is done. Plot profit over time: dip, recovery, overshoot — the letter J.
So 81% with no profit + 1% mature isn’t evidence that AI doesn’t work. It’s an entire industry sitting at the bottom of the J.
4. Measurement lag: much of the value is real — the ledgers just can’t see it.
The biggest piece is consumer surplus: what you’d be willing to pay for something, minus what you actually pay. Maybe ChatGPT is worth $50 a month to you, but you’re on the free plan — that $50 of value really happened, and GDP records zero. Stanford estimates this invisible value at ~$172B a year in the US alone, more than the whole industry’s revenue.
The other two entries work the same way: time saved by AI mostly gets redirected into other work rather than booked as layoffs and cost cuts, so earnings reports can’t see it; and executive surveys ask about recognized profit impact, which naturally trails usage by 12–24 months.
Put the four back into the data, and 2023–2026 compresses into one sentence:
The model layer entered a second acceleration in early 2024 (capability doubling every ~3–4 months, fixed-capability prices falling ~100× a year); the application layer’s usage and revenue are tracking the same exponential one phase behind; and profit — the most lagging indicator of all — is still sitting at the bottom of its J-curve. That’s not a technology slowing down. That’s the standard timetable of a general-purpose technology diffusing.
08 | The 8 Numbers to Watch Over the Next 12 Months
Don’t want to track 43 sources? These 8 numbers will do.
The two tiebreakers:
① The share of companies reporting any AI profit impact (McKinsey survey; currently 39%). This is the J-curve’s pulse: break 50%, and profits are finally landing — the 2024–2026 spending spree turns out to have been a good bet; still stuck under 40% a year from now, and the “we’re just in the J-curve trough” defense stops working — the same bad numbers start to fit “overcapacity” better.
② Compute spending ÷ top-lab revenue (currently ~9×). If the ratio starts converging, revenue is catching up; if it keeps diverging, that’s when the bubble alarm actually rings.
Three for whether models are still accelerating:
③ METR’s 80%-bar horizon (currently 1–2 hours) — is the reliability discount from section 07 shrinking;
④ HLE and FrontierMath scores (currently 46.4% / 39.6%) — how long the last two unbroken yardsticks hold;
⑤ Flagship list prices (Fable 5: $10 per million tokens) — one more hike, and the “intelligence keeps getting cheaper” story needs rewriting.
Three for the application layer and the money:
⑥ The Census Bureau’s all-business adoption rate (currently 19.8%) — when the barbershops and auto shops join in;
⑦ Starting scores on next-gen agent benchmarks — if new yardsticks launch already half-beaten, exam-writing has truly fallen behind;
⑧ Anthropic’s profitable quarter + IPO pricing (projected 2026Q2) — the industry’s first audit-grade proof that AI can make money.
One More Thing
Every conclusion in this piece rests on one hidden assumption: that the yardsticks themselves hold up.
Reality check — HLE has half its range left; a third of FrontierMath’s problems failed audit; METR’s newest data point (~17 hours) slams into the task suite’s 16-hour ceiling and can only be recorded as “≥16 hours” — it can’t even enter the fit.
For the first time, humans are systematically losing the race to write exams faster than AI can pass them.
One person called this a year in advance.
In April 2025, Shunyu Yao — co-author of SWE-bench and τ-bench (both yardsticks cited in this piece), then a researcher at OpenAI, now Tencent’s Chief AI Scientist — published a widely-shared essay, The Second Half. Two claims:
The second half of AI — starting now — will shift focus from solving problems to defining problems. In this new era, evaluation becomes more important than training.
AI has beat world champions at chess and Go, surpassed most humans on SAT and bar exams… But the world hasn’t changed much, at least judged by economics and GDP. I call this the utility problem, and deem it the most important problem for AI.
Why do leaderboards and reality diverge? His root cause: evaluation setups differ from the real world in basic ways. Evals assume the AI runs autonomously start to finish, while real work keeps a human in the loop throughout; evals reset after every task, while real tasks arrive in sequence and entangle.
You’ve probably noticed: everything tangled about section 05 — superhuman benchmarks, failed RCTs, flat profits — reads like a footnote to those two paragraphs.
By the next time we revisit this topic, we may need to invent new rulers first. And the people who can write them are becoming the scarcest resource in the industry.
Notes & limitations: Revenue figures are company-disclosed annualized run-rates — not audited revenue, let alone profit. Census BTOS loosened its questionnaire in Nov 2025, so the series isn’t strictly comparable across the break (shown dashed in the chart). MIT NANDA’s 95% figure is methodologically contested. Our METR doubling-time refit gives 114 days vs. the official TH1.1 figure of 89 days. This piece covers public English-language sources only and systematically understates progress in China and the open-source ecosystem.
Primary sources: Stanford HAI AI Index 2026 · Epoch AI (ECI / inference prices / FrontierMath) · METR (arXiv:2503.14499, Time Horizon 1.1) · OpenAI / Anthropic / Google disclosures · McKinsey State of AI · US Census BTOS · Ramp AI Index · QJE 140(2) · arXiv:2302.06590 · SSRN 4945566 · HBS WP 24-013 · NBER w33777/w34255 · MIT NANDA · Sequoia “AI’s $600B Question” · Shunyu Yao “The Second Half” (Apr 2025) · Crunchbase · Menlo Ventures · Bain Global Technology Report